
If you ever wonder whether statistics is the right path for you — but aren't sure if it’s all just formulas and headaches — you’re in the right place.
I didn’t start out knowing I wanted to study statistics. I never saw myself as a “math person".
I needed a path where the concepts weren’t abstract, but applied. Eventually, I found my fit in quantitative management, where stats felt practical, and connected to real decisions— and that led to a career in tech.
Statistics is where curiosity meets structure. Whether you're analyzing trends, studying cause and effect, or validating decisions with data, statistical thinking helps learners ask the right questions and uncover the “why” behind the “what".
What is Statistics, Really?
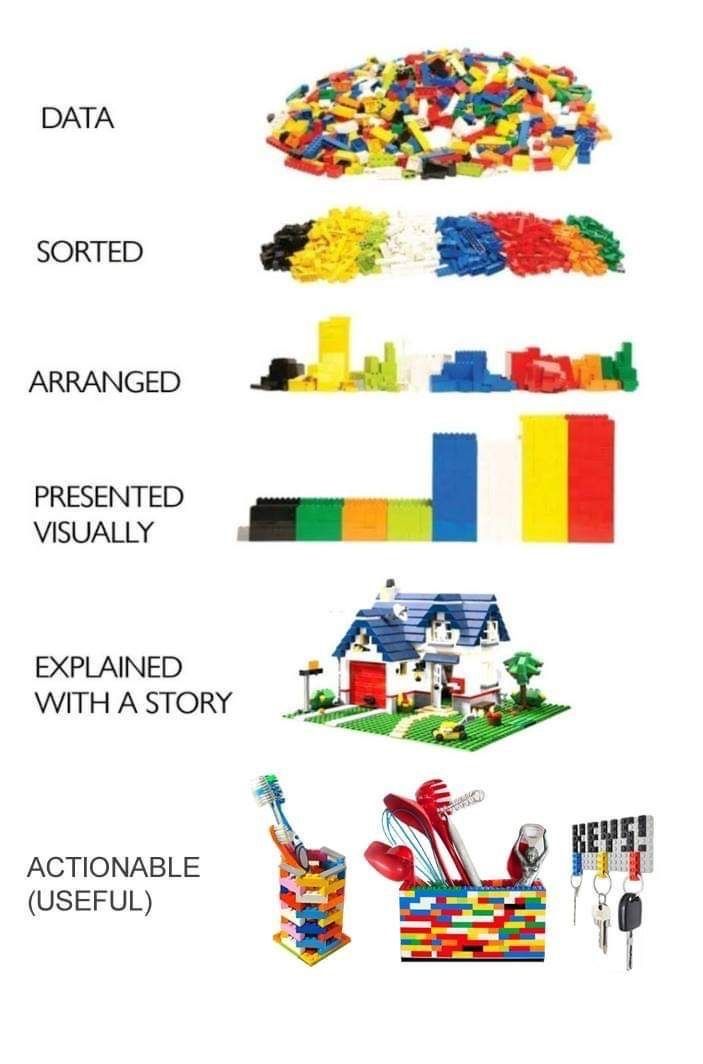
Encyclopædia Britannica defines statistics as "the science of collecting, analyzing, presenting, and interpreting data." But data isn’t just about the numbers — it’s evidence. It’s how we uncover truth and shape the stories that drive understanding, action, and change.
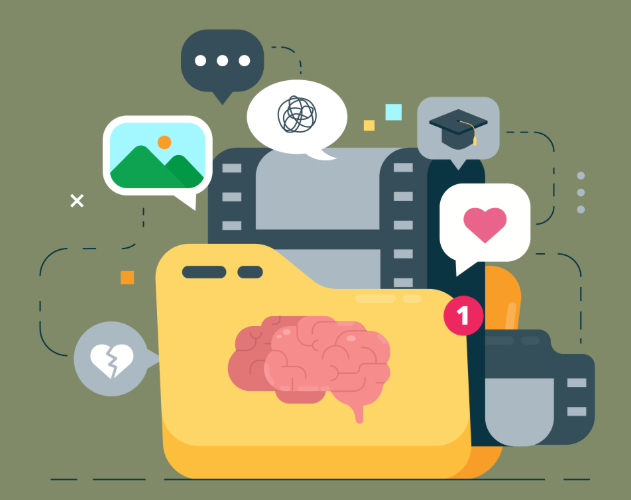
Statistics is how we make sense of uncertainty. It helps us predict outcomes, spot patterns, and ask the big questions:
What’s real?
What’s noise?
What’s missing?
Think of a time you made a decision based on reviews or social media.
What did you trust? What did you ignore? What did you feel was missing?
What You'll Learn and Study
Think: “We surveyed 1,000 people — what does that say about 10 million?”
To answer questions like that, statistics students study how numbers behave, what they reveal, and how to use them responsibly.
That means learning mathematical foundations like calculus and linear algebra, and real-world data applications through core areas like:
Probability: Figuring out how likely an event is with data
Inference: Drawing conclusions from limited data
Modeling: Finding relationships in data
Data visualization: Creating visual "stories" with data
Computational tools: Learning technologies to handle data
Experimental design: Structuring studies with minimal bias driven by data
 Graphic by Marcus Koehnlein
Statistics is how we interrogate reality.
Data is how we uncover truth.
Storytelling is how we make that truth matter.
Quiz
Say you’re analyzing survey data from 1,000 people to estimate behavior across 10 million. What’s the biggest risk if your sample isn’t representative?
Build Skills That Apply Everywhere
Beyond number crunching, statistical thinking shows up in every role and every field. It shapes the world behind the scenes — in places you might not expect.
From product design to public health, from marketing to climate science (and more!) — stats help teams ask sharper questions and make decisions that matter.
But what does that look like in your coursework or your career?
It starts with skills you build.
 Photo by Clayton Robbins on Unsplash
Skills and Why They Matter
Math foundations: Help you understand how numbers work — useful in finance, logistics, and science
Conceptual thinking: Helps learners ask smart questions and spot bias - great for research and design
Real-world data analysis: Helps you make sense of messy data in areas like marketing, sports, and social media
Data visualization: Turns numbers into visuals — important in product design, media, and advocacy
Statistical software fluency: Works with programs & tools to automate and scale projects — in fields like tech, health, and business
Communication: Share ideas in ways others can understand — important for consulting and management
See the Bigger Picture
Take a moment to assess your goals, interests, and readiness.
Statistics is not just about numbers — it's about the stories data tell about people, systems, and change over time.
Think: "Is this field aligned with how I think and what I care about?"
 Photo by Tanja Tepavac on Unsplash
Succeeding in statistics doesn’t mean solving math problems. It means knowing how to:
Think clearly when things are messy → and figure out what matters
Work with data that isn’t perfect → and still find useful patterns
Use tools to explore and explain → like Excel, R, or Python
Notice when something feels off → and know how to dig deeper
Share your thinking with others → so they understand why it matters and what to do
Evaluate Coursework and Program Fit
Statistics is a toolkit for making sense of the world — especially if you enjoy gathering information, exploring perspectives, and applying your skills across disciplines.
 Photo by Jakub Żerdzicki on Unsplash
But let’s be real: the fun stuff doesn’t happen right away. And there is no one way to do it.
Traditional Schooling: The Long Game
You learn to build a strong foundation and depth over time.
Years 1 & 2: Math (and a lot of it) — lectures, problem sets, and discussions.
Year 3: Statistical theory, fundamentals, and proofs, where things start to click.
Year 4: Real data, case studies, computing labs ( i.e. R, SAS, Python, SPSS) , and concentration requirements, where everything comes to together.
Not ready for the full coursework? Statistics works well as a minor, and many schools may also offer concentrations in:
 Photo by Markus Spiske on Unsplash
Bootcamps and Micromasters: Fast Track
Prefer a compressed timeline? Bootcamps emphasize practical fluency over theory.
Phase 1: Core concepts — Core math and basic coding.
Phase 2: Tools & technology — Learn Excel, R, Python, or SQL through labs, walkthroughs, and lots of debugging.
Phase 3: Real-world projects — Work with real data, build apps and dashboards, and present findings.
Take Action
Is studying statistics right for you?
 Photo by Anthony Tran on Unsplash
Remember, you’re not choosing a lifetime identity. You’re choosing a toolkit, and statistics is one of the most flexible ones out there.
Your feedback matters to us.
This Byte helped me better understand the topic.